Test Images
Ergosoft 16 comes with several test images to help you evaluate your printer calibration and print configuration. These test images can easily be accessed from within the RIP by going to Tools > Linearization & Profiling Tools > Test Images.
CMYK Color Chart (CMYK_Colors_Chart.eps and CMYK_Colors_Chart.pdf)
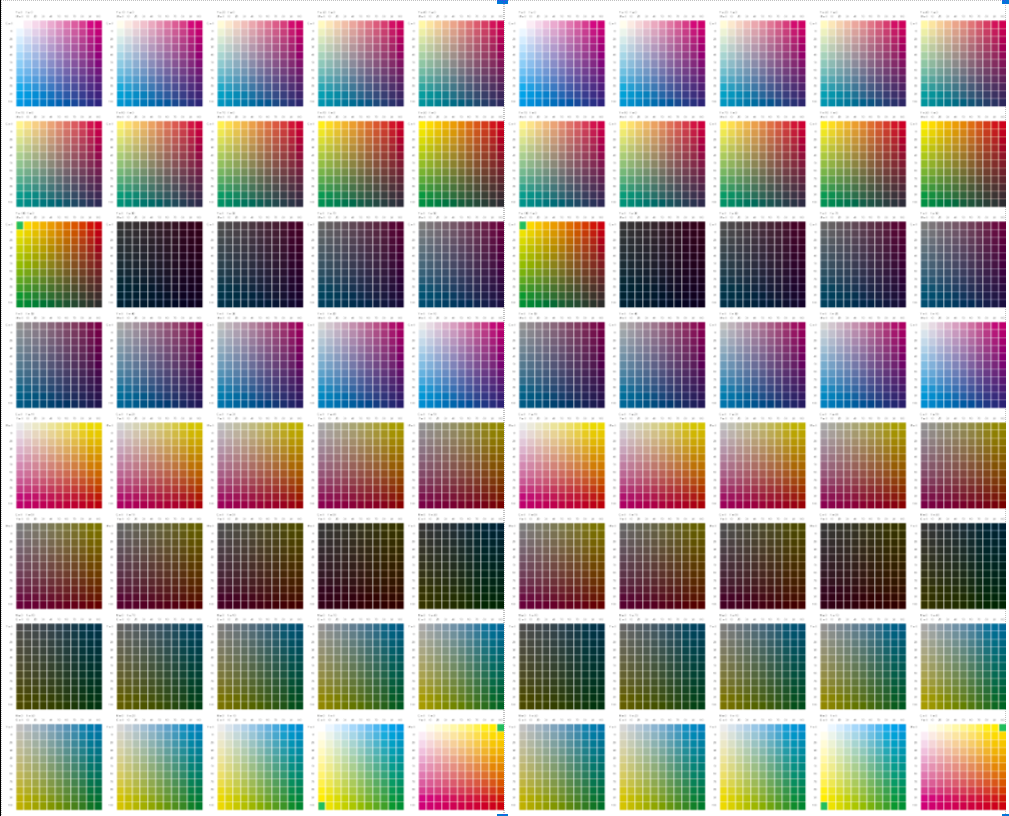
A chart containing color patches in CMYK. This chart can be helpful to see how a range of CMYK values is printed with your configuration e.g. if there are any large inconsistencies in the profile. This chart is available in both EPS and PDF format.
Profile Evaluation Chart (ProfileEvaluationChart_160429_Lab.tif)
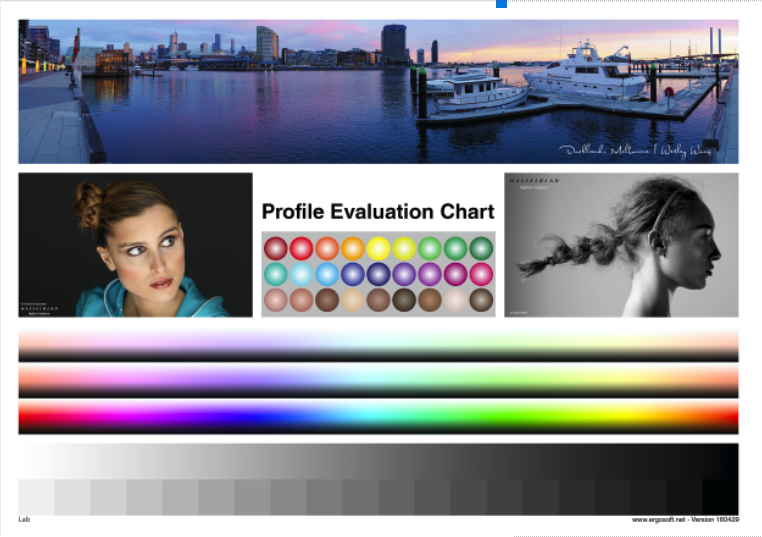
The Profile Evaluation Chart is a classic print test chart that contains different types of elements such as fotos, color patches and gradients to help you evaluate the quality of your color output calibration.
Total Ink Limit Charts
There are four files for Total Ink Limit Charts:
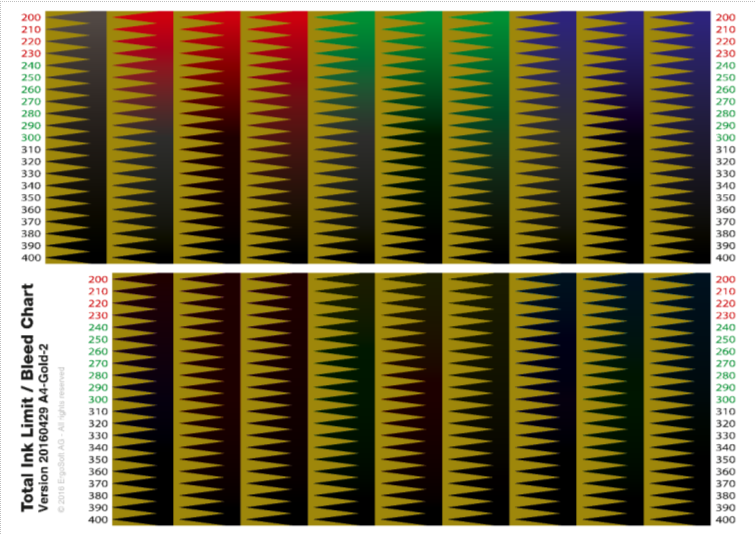 TotalInkLimit_A4Gold1_160429.pdf
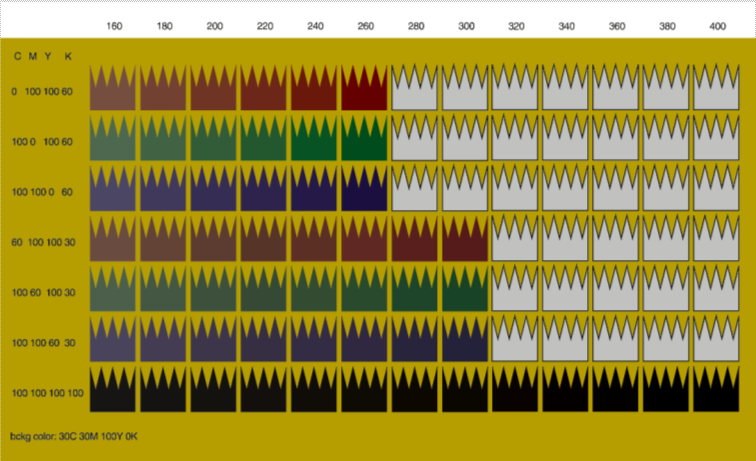 TotalInkLimit_A4Gold2_160429.pdf
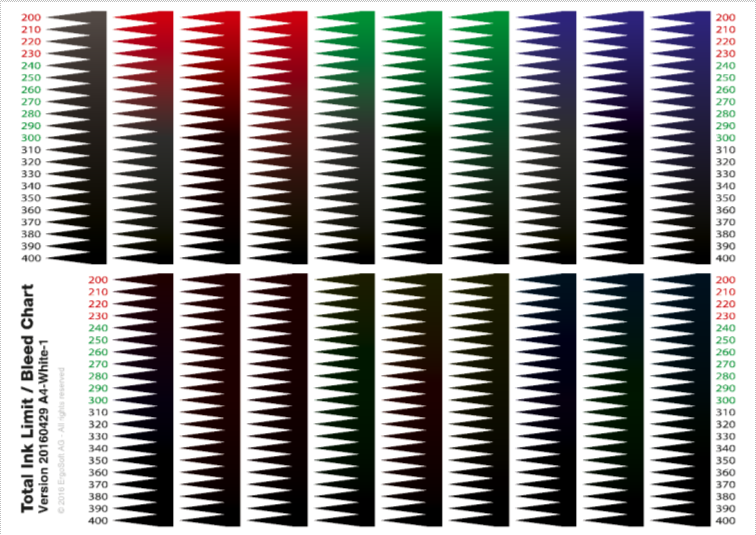 TotalInkLimit_A4White1_160429.pdf
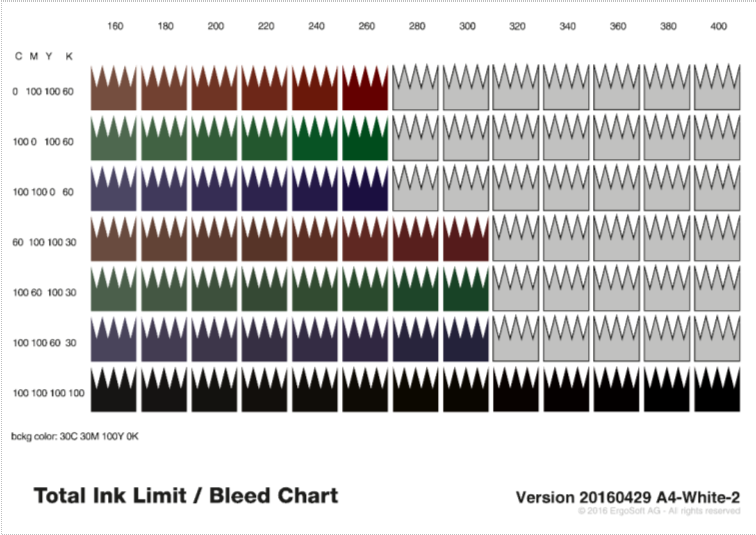 TotalInkLimit_A4White2_160429.pdf
These charts are in the output calibration process to determine the maximum amount of ink that can be applied to a material without the ink bleeding, flaking or pooling. For more information on calibrating the Totalk Ink Limit, see the article Output Calibration > Total Ink Limit.