SwatchMatcher
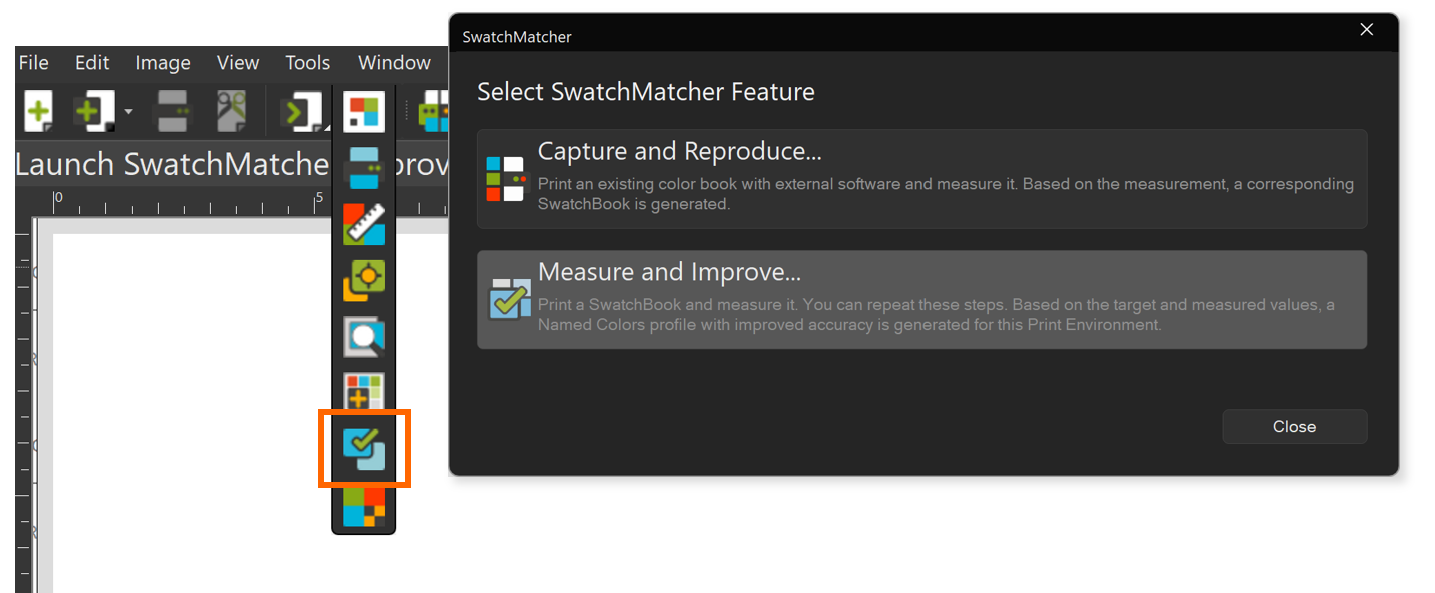
Ergosoft SwatchMatcher is a tool that lets users measure and match color swatches. As of 17.3, SwatchMatcher comes with two tools:
Capture and Reproduce lets you measure Swatchbooks and reproduce the colors with your Ergosoft workflow.
Measure and Improve lets you further improve specific colors in a Swatchbook for better color reproduction. This can be useful if you need to match specific colors by adjusting the specific recipe in the swatchbook based on measurements.
Capture and Reproduce
This tool lets you create a SwatchBook by measuring the behavior of an established workflow. E.g. if you have a print setup using a SwatchBook in a third-party software solution and want to mimic this software’s behavior.
You might be thinking "Why don’t I just import the existing SwatchBook since it’s in device independent Lab?". Simply importing an external SwatchBook into Ergosoft RIP might not result in the same color output as before, since important factors like density, output profile and color engine might not match, resulting in different interpretation of the Lab values.
Luckily, you can use the SwatchMatcher-tool to create a new SwatchBook in Ergosoft that matches the external SwatchBooks color output in your Ergosoft RIP workflow.
To achieve this, SwatchMatcher generates a chart in TIFF Format (16-bit Lab or 8-bit) based on the existing SwatchBook that you can print out using your existing solution. You then measure this chart in Ergosoft. SwatchMatcher will generate a new SwatchBook based on the measurements with adjusted target Lab values so you can accurately reproduce the colorbook swatches in Ergosoft.
To access the SwatchMatcher, go to Tools > Colors & Special Features > SwatchMatcher or use the button in the Toolbar.
Note that this feature generates a TIFF chart that needs to be printed using the print workflow that should be replicated and then measured with a Spectrophotometer.
Importing an external Swatchbook
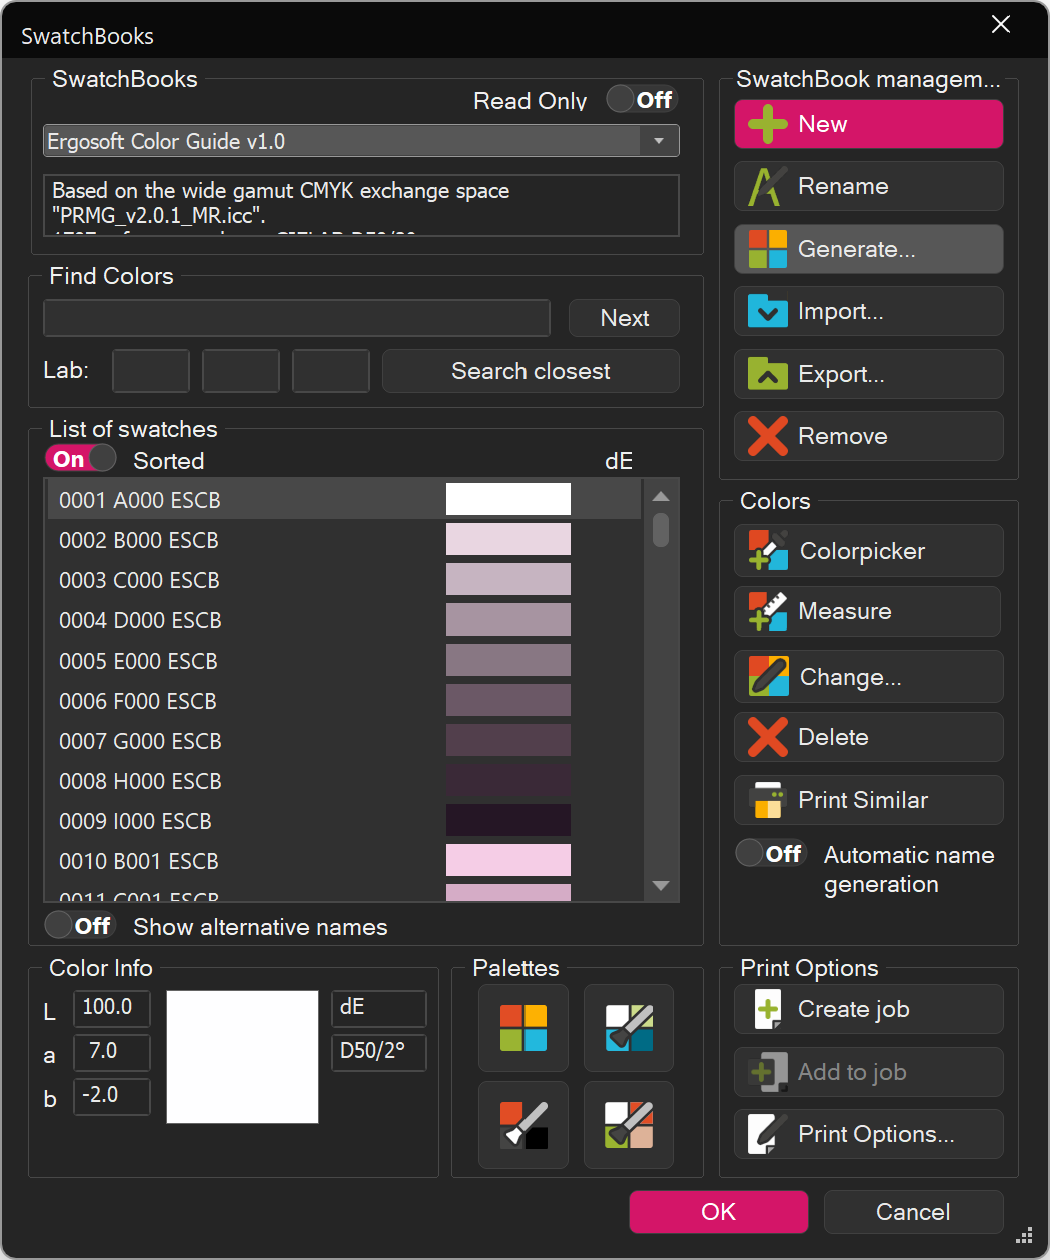
To use the SwatchMatcher, first import your external SwatchBook into Ergosoft by starting the SwatchBook-application through the button in the Toolbar, or in Tools > Color & Special Features > SwatchBooks… In SwatchBooks, use the Import button and navigate to your SwatchBook file. Confirm the import, quickly verify the SwatchBook colors to make sure everything looks correct then confirm the SwatchBook dialog.
Generating and Measuring the SwatchMatcher Chart
To generate a SwatchMatcher Chart, start the SwatchMatcher tool in Tools > Colors & Special Features > SwatchMatcher or use the button in the Toolbar.
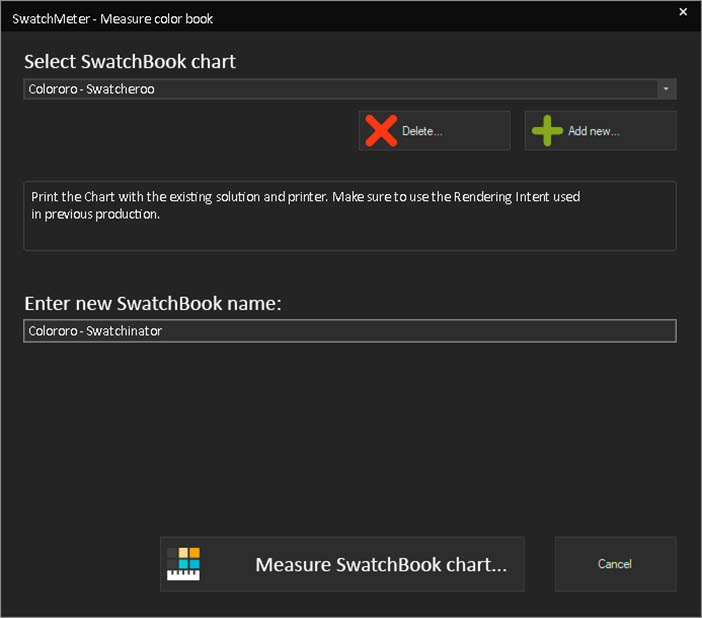
The dropdown-menu at the top of the dialog will show a list of SwatchBook charts that are available to measure (This will be empty by default). Click Add New to create a new chart. This opens a new dialog where you can customize the chart.
Select the SwatchBook we imported in the first step for the Chart.
Use select chart geometry to select a suitable chart layout for your measuring device. If you have already detected your measuring device, the dropdown-menu should pre-filter and only show suitable geometries. If you want to see all available geometries, check the box Show All.
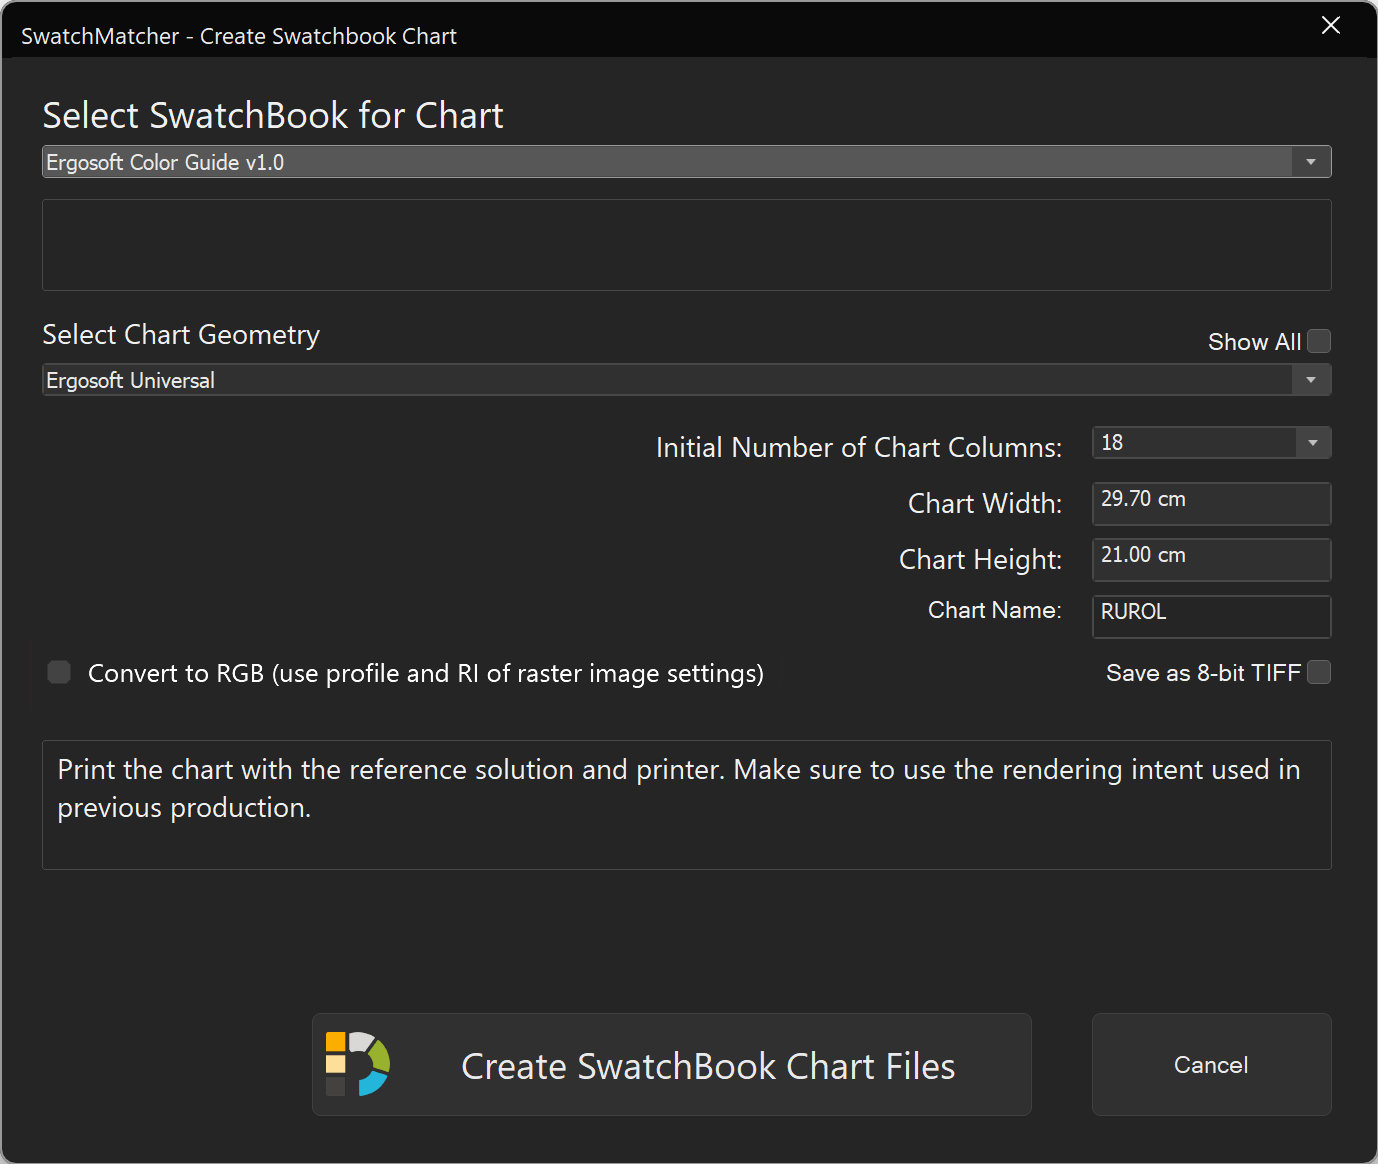
Use Initial Number of Chart Columns to define how many columns of color patches should be included in the chart. A smaller number of columns means smaller charts, but they can better fill out the material, potentially saving media. Chart Width, Chart Height, Chart Name are automatically calculated to show you the size of the chart and the name to identify it.
You can check Save as 8-bit TIFF if the program used to print the chart has trouble loading 16-bit TIFFs.
Check Convert to RGB (Use Profile and RI of Raster Image Settings) to save the Color Chart as an RGB TIFF instead of the standard LAB.
When you are satisfied with the settings, click Create SwatchBook Chart Files. Select a save location for your density chart file and confirm. This will return you to the Measure SwatchBook Chart window.
Take the TIFF Chart file and print it using the workflow you want to replicate.
Once the chart is printed, you will be returned to the Measure SwatchBook Chart window. Make sure the correct chart is selected in the dropdown at the top and enter a name for your new SwatchBook.
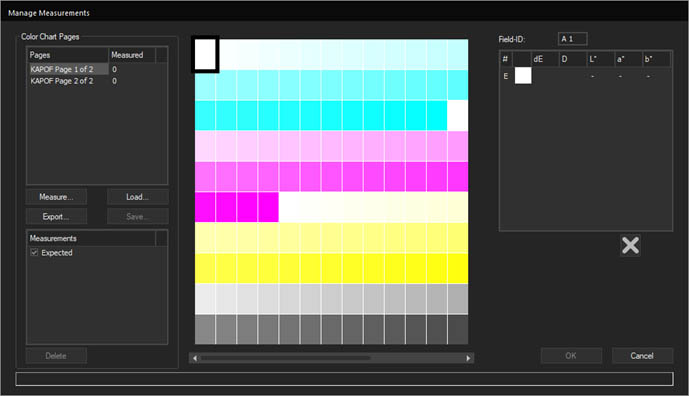
Click Measure SwatchBook Chart... This opens the standard Manage Measurement dialog (For more information on conducting measurements, see the Output Calibration chapter). Measure the chart completely and finally confirm with Ok.
After confirming, SwatchMatcher will use the measurement results to create a new SwatchBook based on the measurement results with the name you specified. You can find your new SwatchBook in the SwatchBooks-tool at Tools > Color & Special Features > SwatchBooks…
The colors in the SwatchBook are saved with adjusted Lab values that ensure that if you print one of the colors from the SwatchBook in Ergosoft RIP, it will look the same as it does printed from your existing external solution.
Measure and Improve
Serves to improve the output of specific Swatchbook colors. If your swatchbook contains colors that are either unsatisfactory in output or need to be especially accurate (Such as Company colors etc.) SwatchMatcher can help improve reproduction for these reference spot colors without having to go through a whole new density correction and ICC profiling cycle.
- To start the measure and improve process, activate the Print Environment that should receive a Named Colors profile with improved color accuracy for the important spot colors in the Swatchbook.
- Configure and connect to the spectrophotometer under Tools > Application Defaults > Spectrophotometer.
- Launch the SwatchMatcher by going to Tools > Colors and Special Features > SwatchMatcher and select the Measure and Improve module.
- Start a new session.
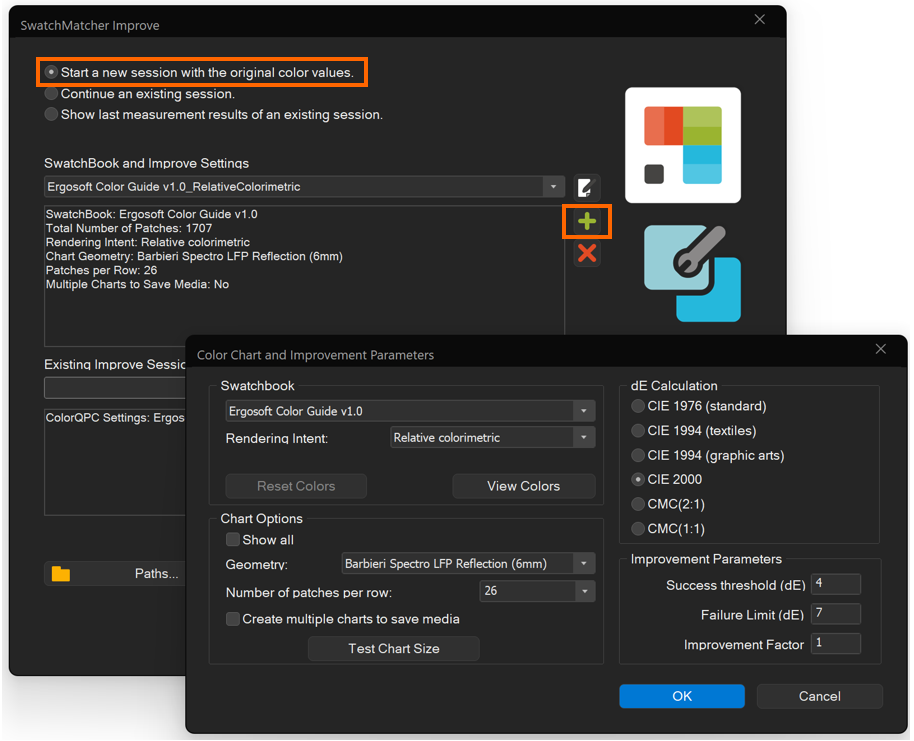
- Add a new setting configuration preset:
- Select the target SwatchBook and the used Rendering Intent that is normally used when color replacement functions are applied (relative colorimetric recommended).
- Select the measuring device and preferred printing chart options.
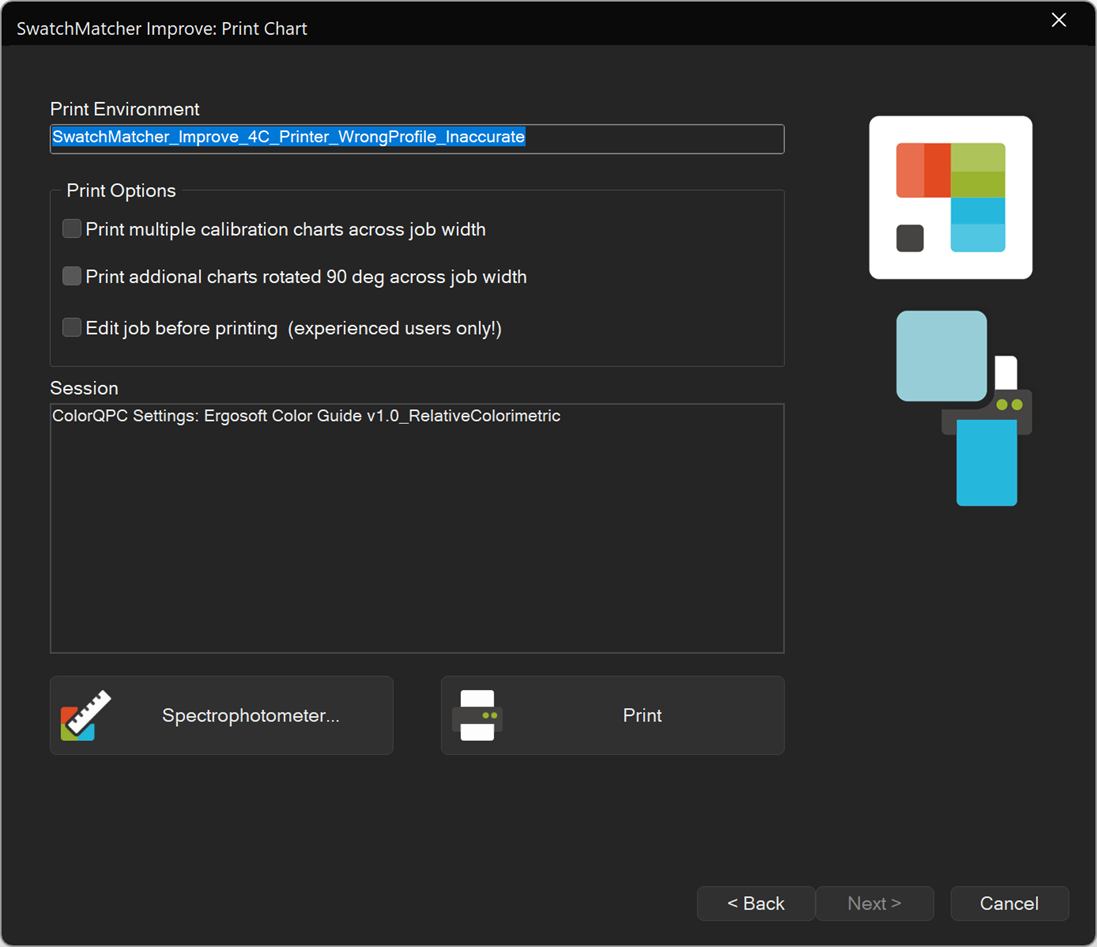
- Set additional preferences: dE standard (CIE 2000 recommended), statistics thresholds and improvement factor (1.0 recommended). - Click Next and print the chart on the following Print Wizard page that follows.
- Click Next and measure the measuring chart consisting of all colors of the Swatchbook you selected.
At this stage, SwatchMatcher Improve can optionally apply a predicted correction when generating the Named Colors profile. This correction is based on the data of the target values and the actual values (uncorrected raw values). No Session or Progress Report can be created, as no data on the accuracy of the predicted correction is available at this point.
Recommended: Continue with (at least) one print & measure iteration before generating the final Named Colors profile with improved color accuracy. - Click << Print again to start the first improvement iteration.
- Print the chart on the next Wizard print page.
- Click Next and measure the measuring chart containing all the colors in the Swatchbook.
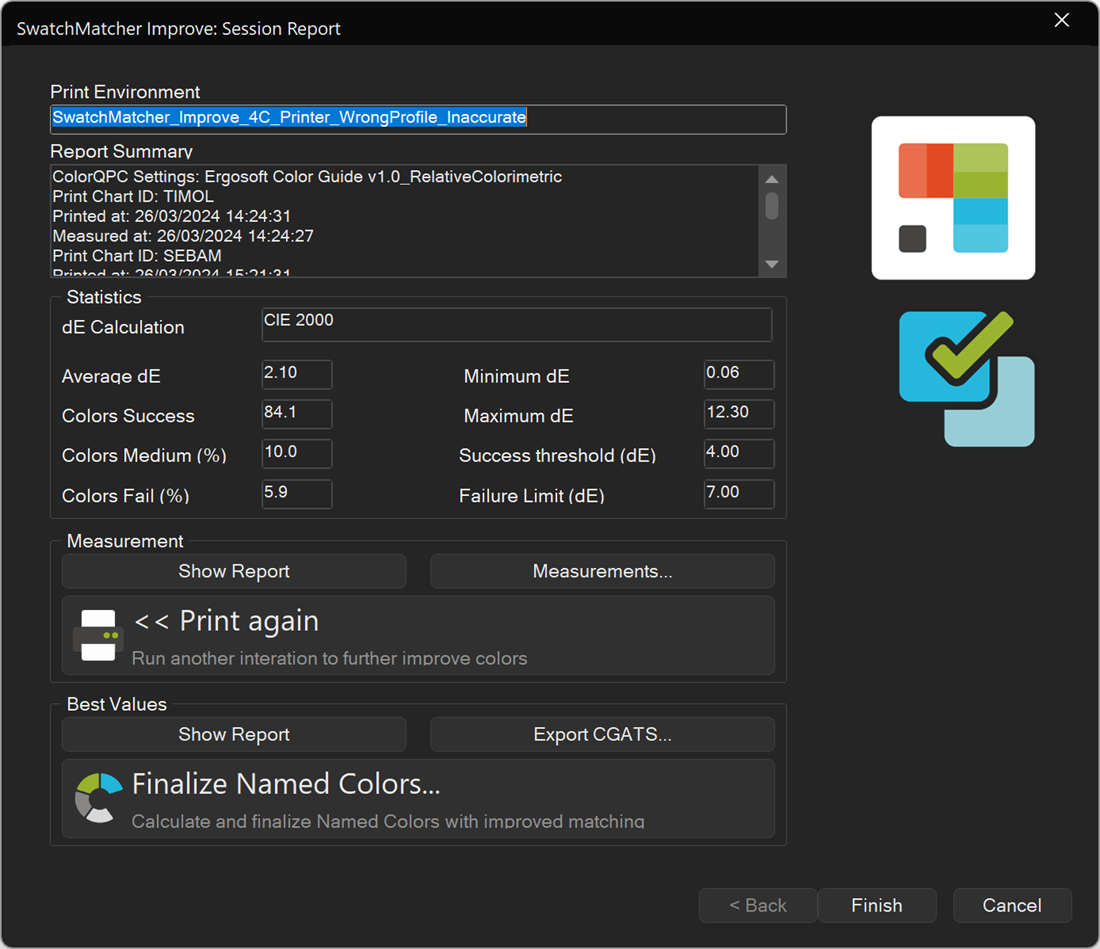
- Click Next to display the color accuracy status statistics based on the last measurements.
- Optionally, you can generate a detailed HTM report of this session by clicking Show Session Report.
The first iteration of improvements is now complete. The Finalize Named Colors... function becomes available and a detailed preview summary report called the Progress Report can be generated. In addition to the general statistics shown in the Wizard page, the detailed Progress Report also shows the achieved accuracy results, listing the target versus improved values for each color. The improved value is always the print recipe with the lowest dE of all iterations combined, including the initial value for each color. - Click << Print again to start the second improvement iteration.
- Print the chart on the next Wizard print page.
- Click Next and measure the measuring chart using all the colors in your Swatchbook.
- Click Next to display the color accuracy status statistics based on the last measurements.
- Optionally, generate a detailed HTM report of this session by clicking show Session Report.
- Click show Progress Report to compile a preview of the current improvements.
- Repeat this last set of steps as many times until the Progress Report shows the desired accuracy statistics.
- Click Finalize Named Colors… >> The SwatchMatcher Improve feature generates the final Named Colors profile and embeds it into the target Print Environment.
The improved spot colors values of the Swatchbook are now accessible to all color replacements and colorways (e.g., ColorCombine) features.
Graphs based on a real case run of SwatchMatcher Improve
In this section we will look at the statistics for a a run of SwatchMatcher from a real life use case. The starting position was as follows:
Target company color standard - Ergosoft Color Guide v1.0
- Based on the wide gamut CMYK exchange space "PRMG_v2.0.1_MR.icc".
- 1707 reference colors.
- CIELAB D50/2°.
Target printer color space
- Paper pigment.
- Semigloss.
- Gamut size: Medium (plus).
- Expected accuracy within printer gamut: Low to medium.
The initial average ΔE (CIE2000), including all out-of-gamut reference colors, was approximately 6.5.
Here are the visualized results in different charts after each step. Conclusions drawn from these charts:
Figure 1 - Average ΔE for three threshold areas
- Even the predicted correction based on one print and measure interval promises a significant reduction of the average ΔE in each range.
- After the second iteration (printing and measuring 3 times), the following iterations start to decrease the effort in relation to the accuracy improvement (in all three averages ΔE of the threshold segments).
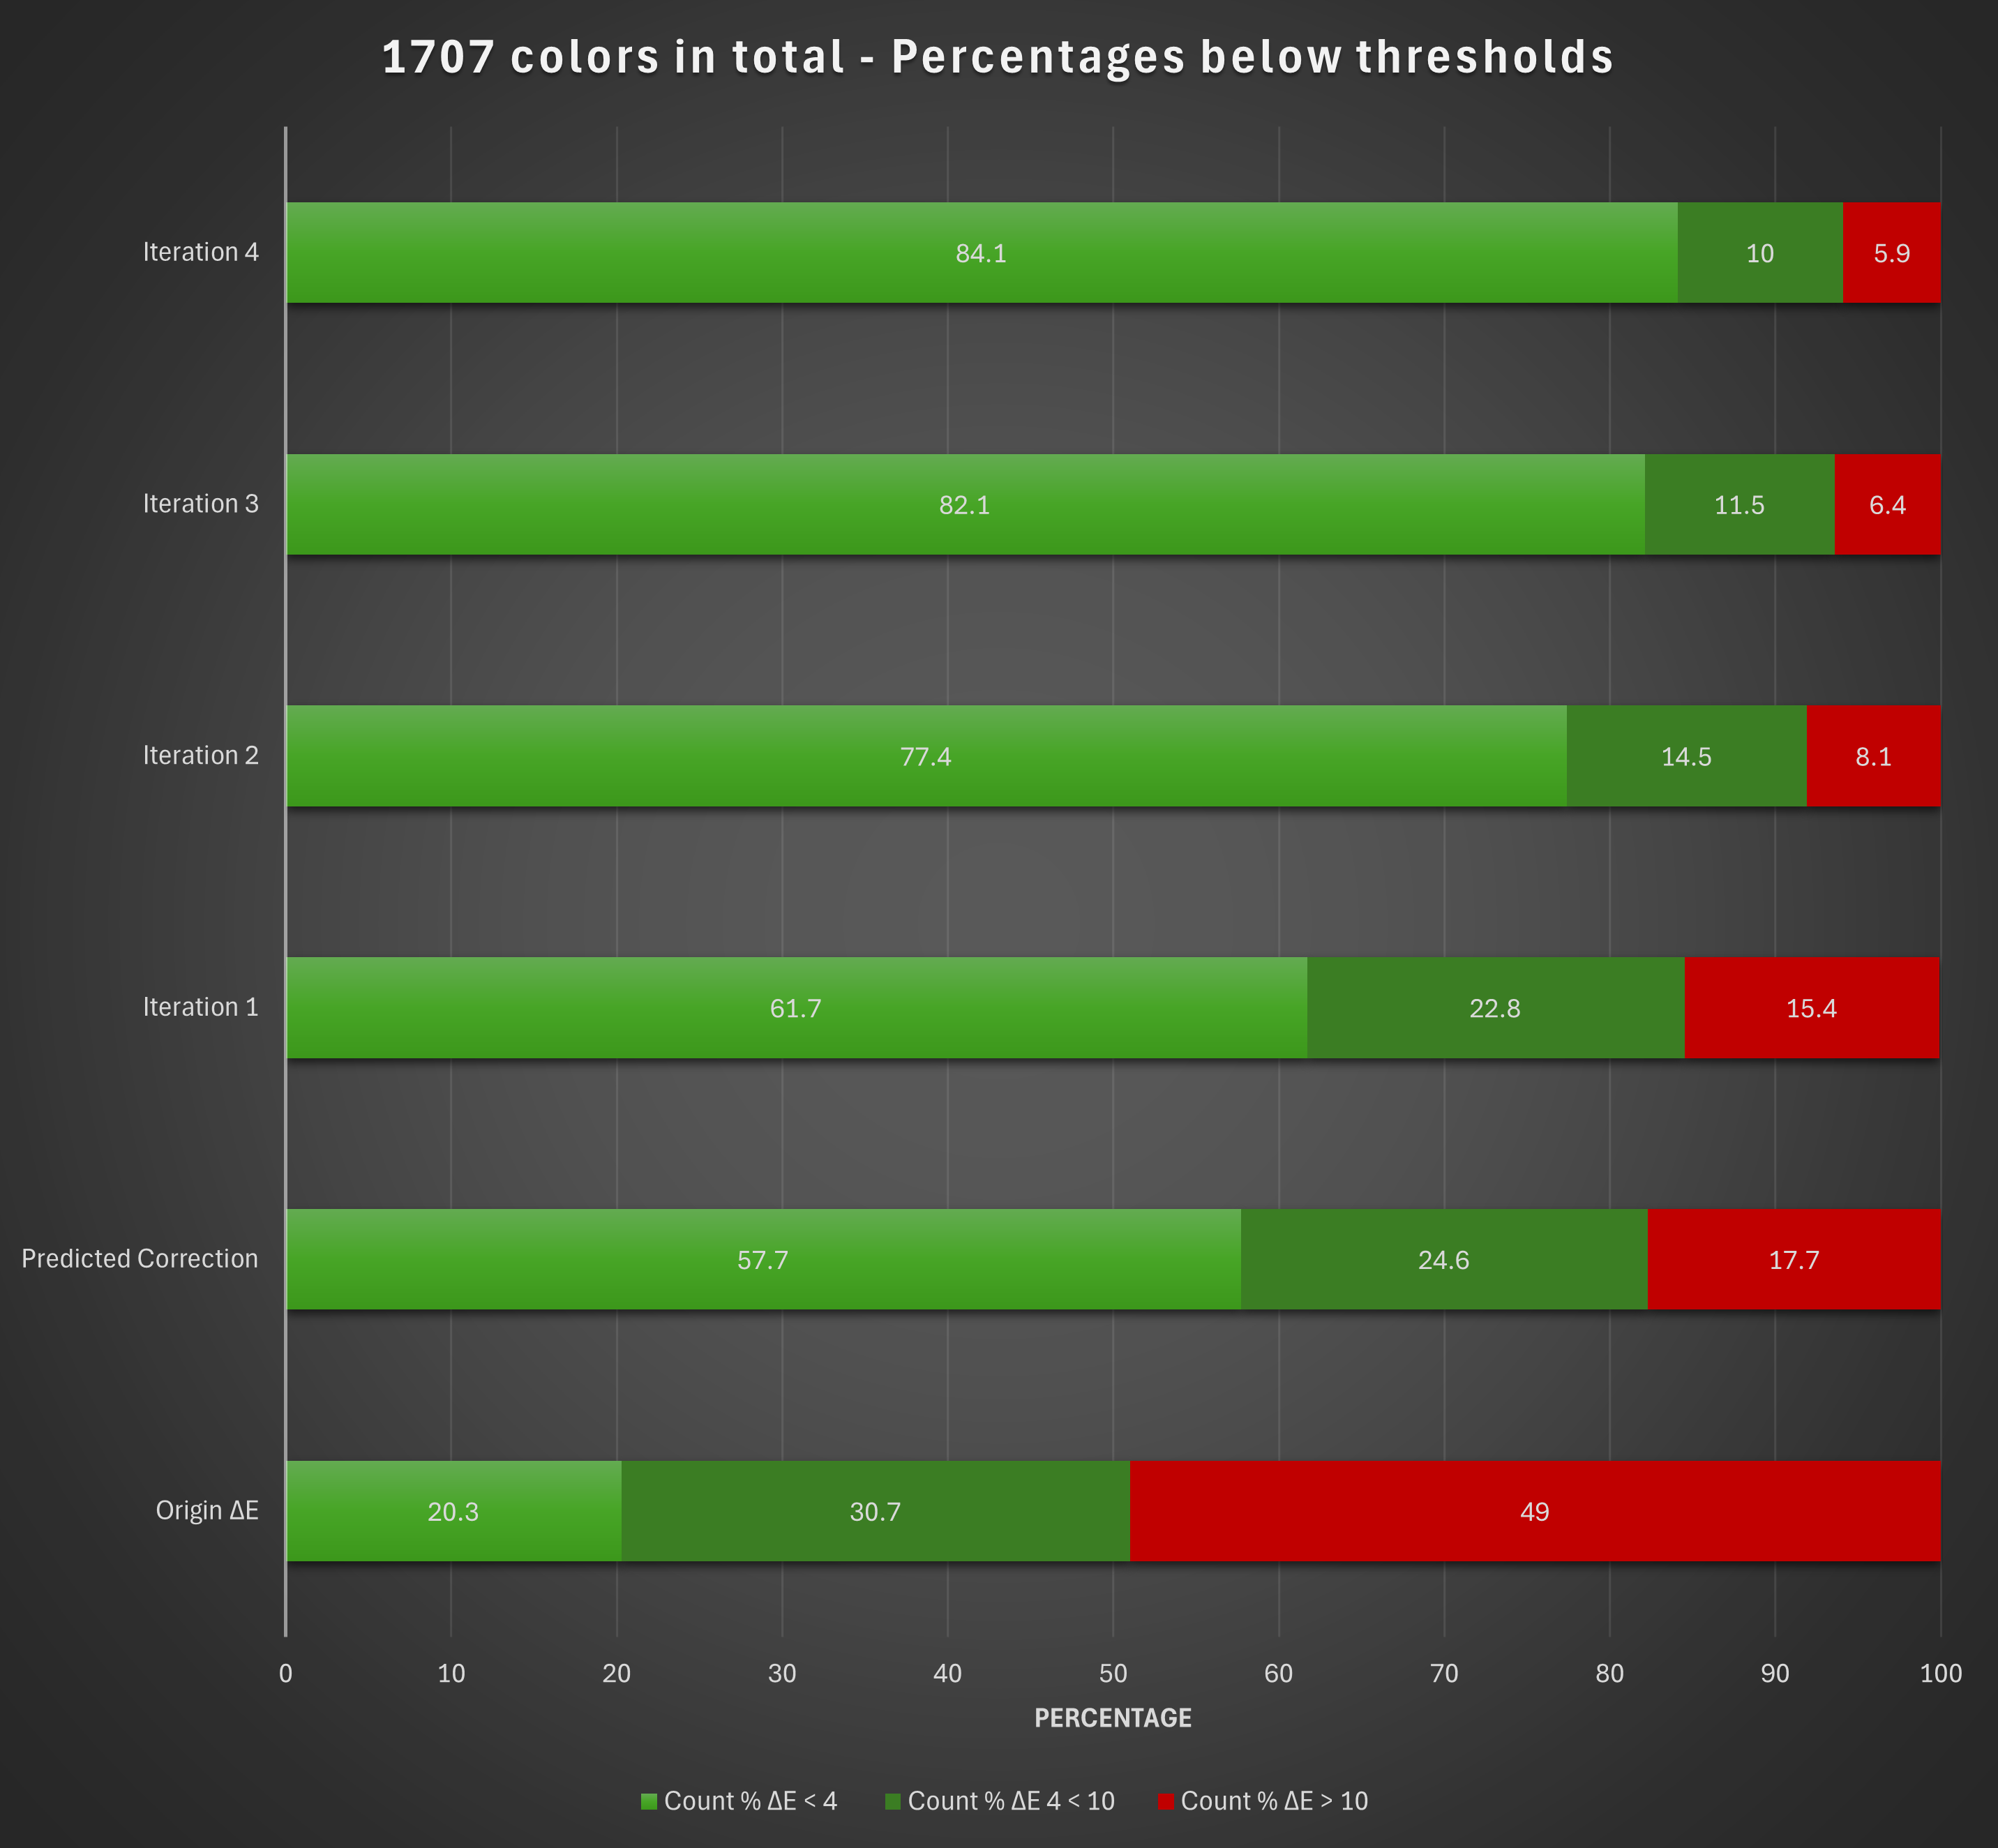
Figure 2 - Average ΔE all colors / Peak and minimum Average ΔE
- Even the predicted correction based on one print and one measurement interval promises a significant reduction in the average ΔE of all colors in the color book. However for some colors, especially if they are out of gamut, the predicted correction may result in poorer accuracy.
- After the first full iteration (printing and measuring twice), the SwatchMatcher Improve algorithm makes sure that no color has a higher ΔE than it had at the starting position.
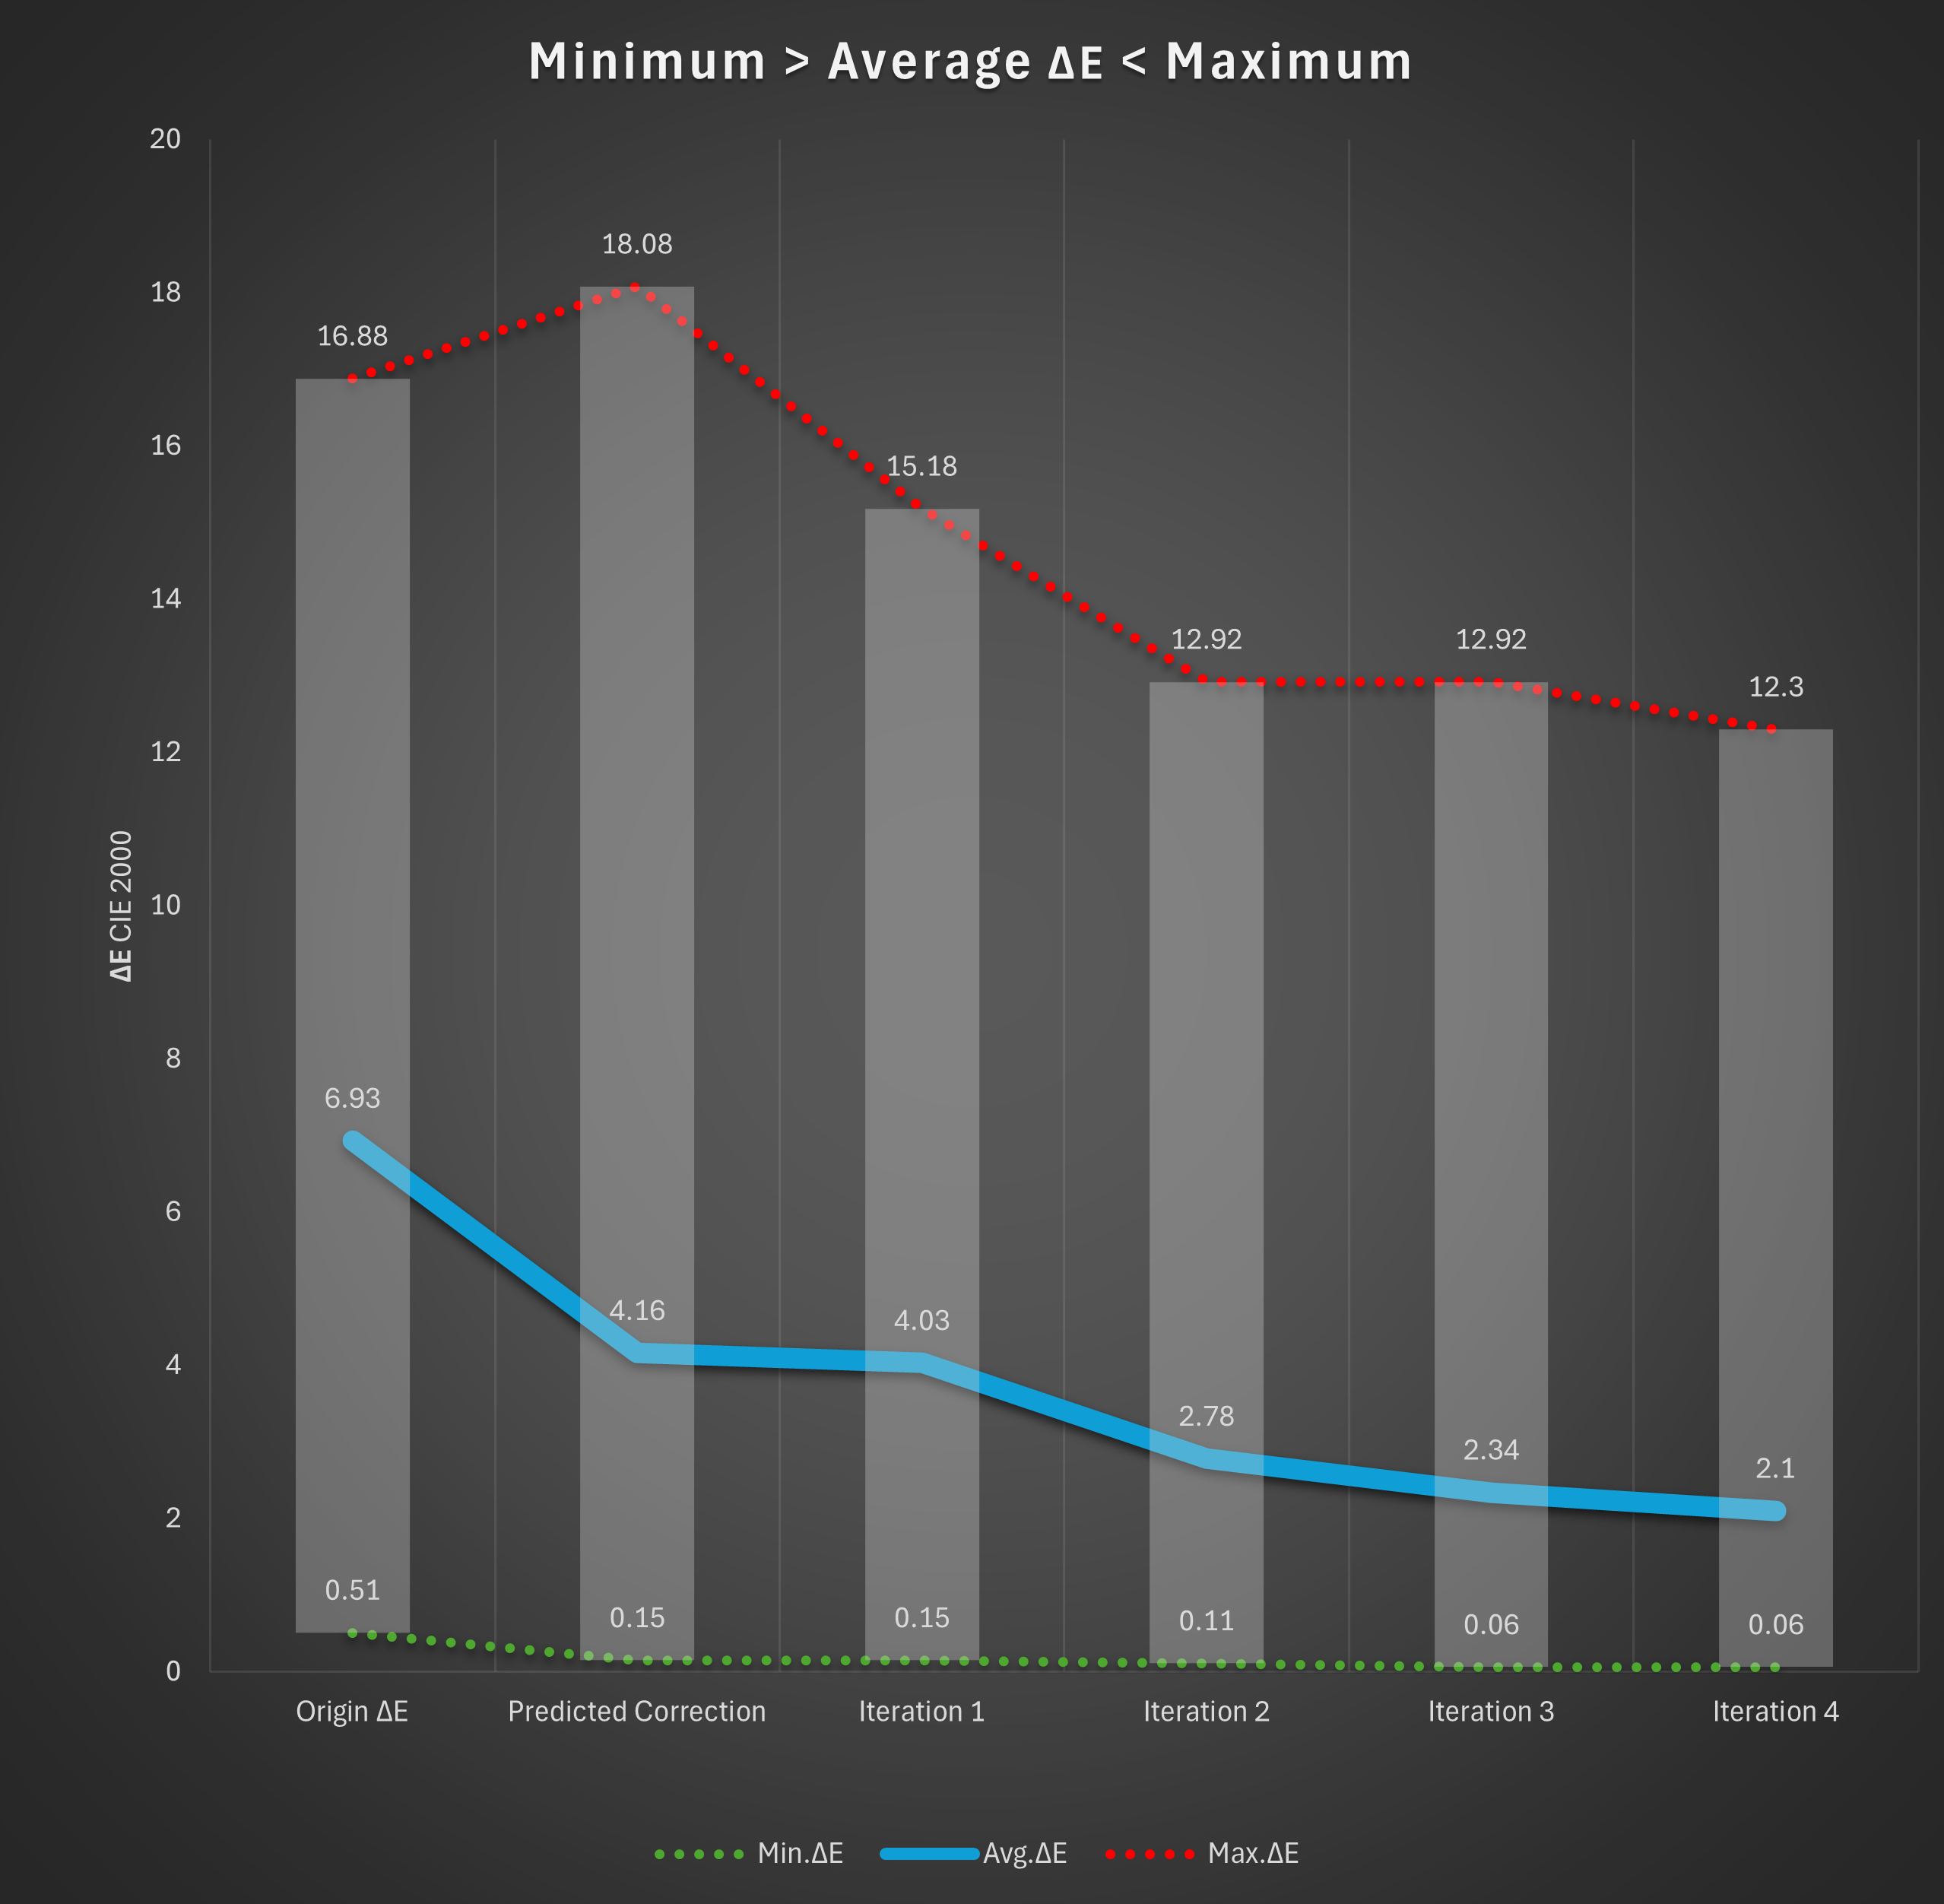
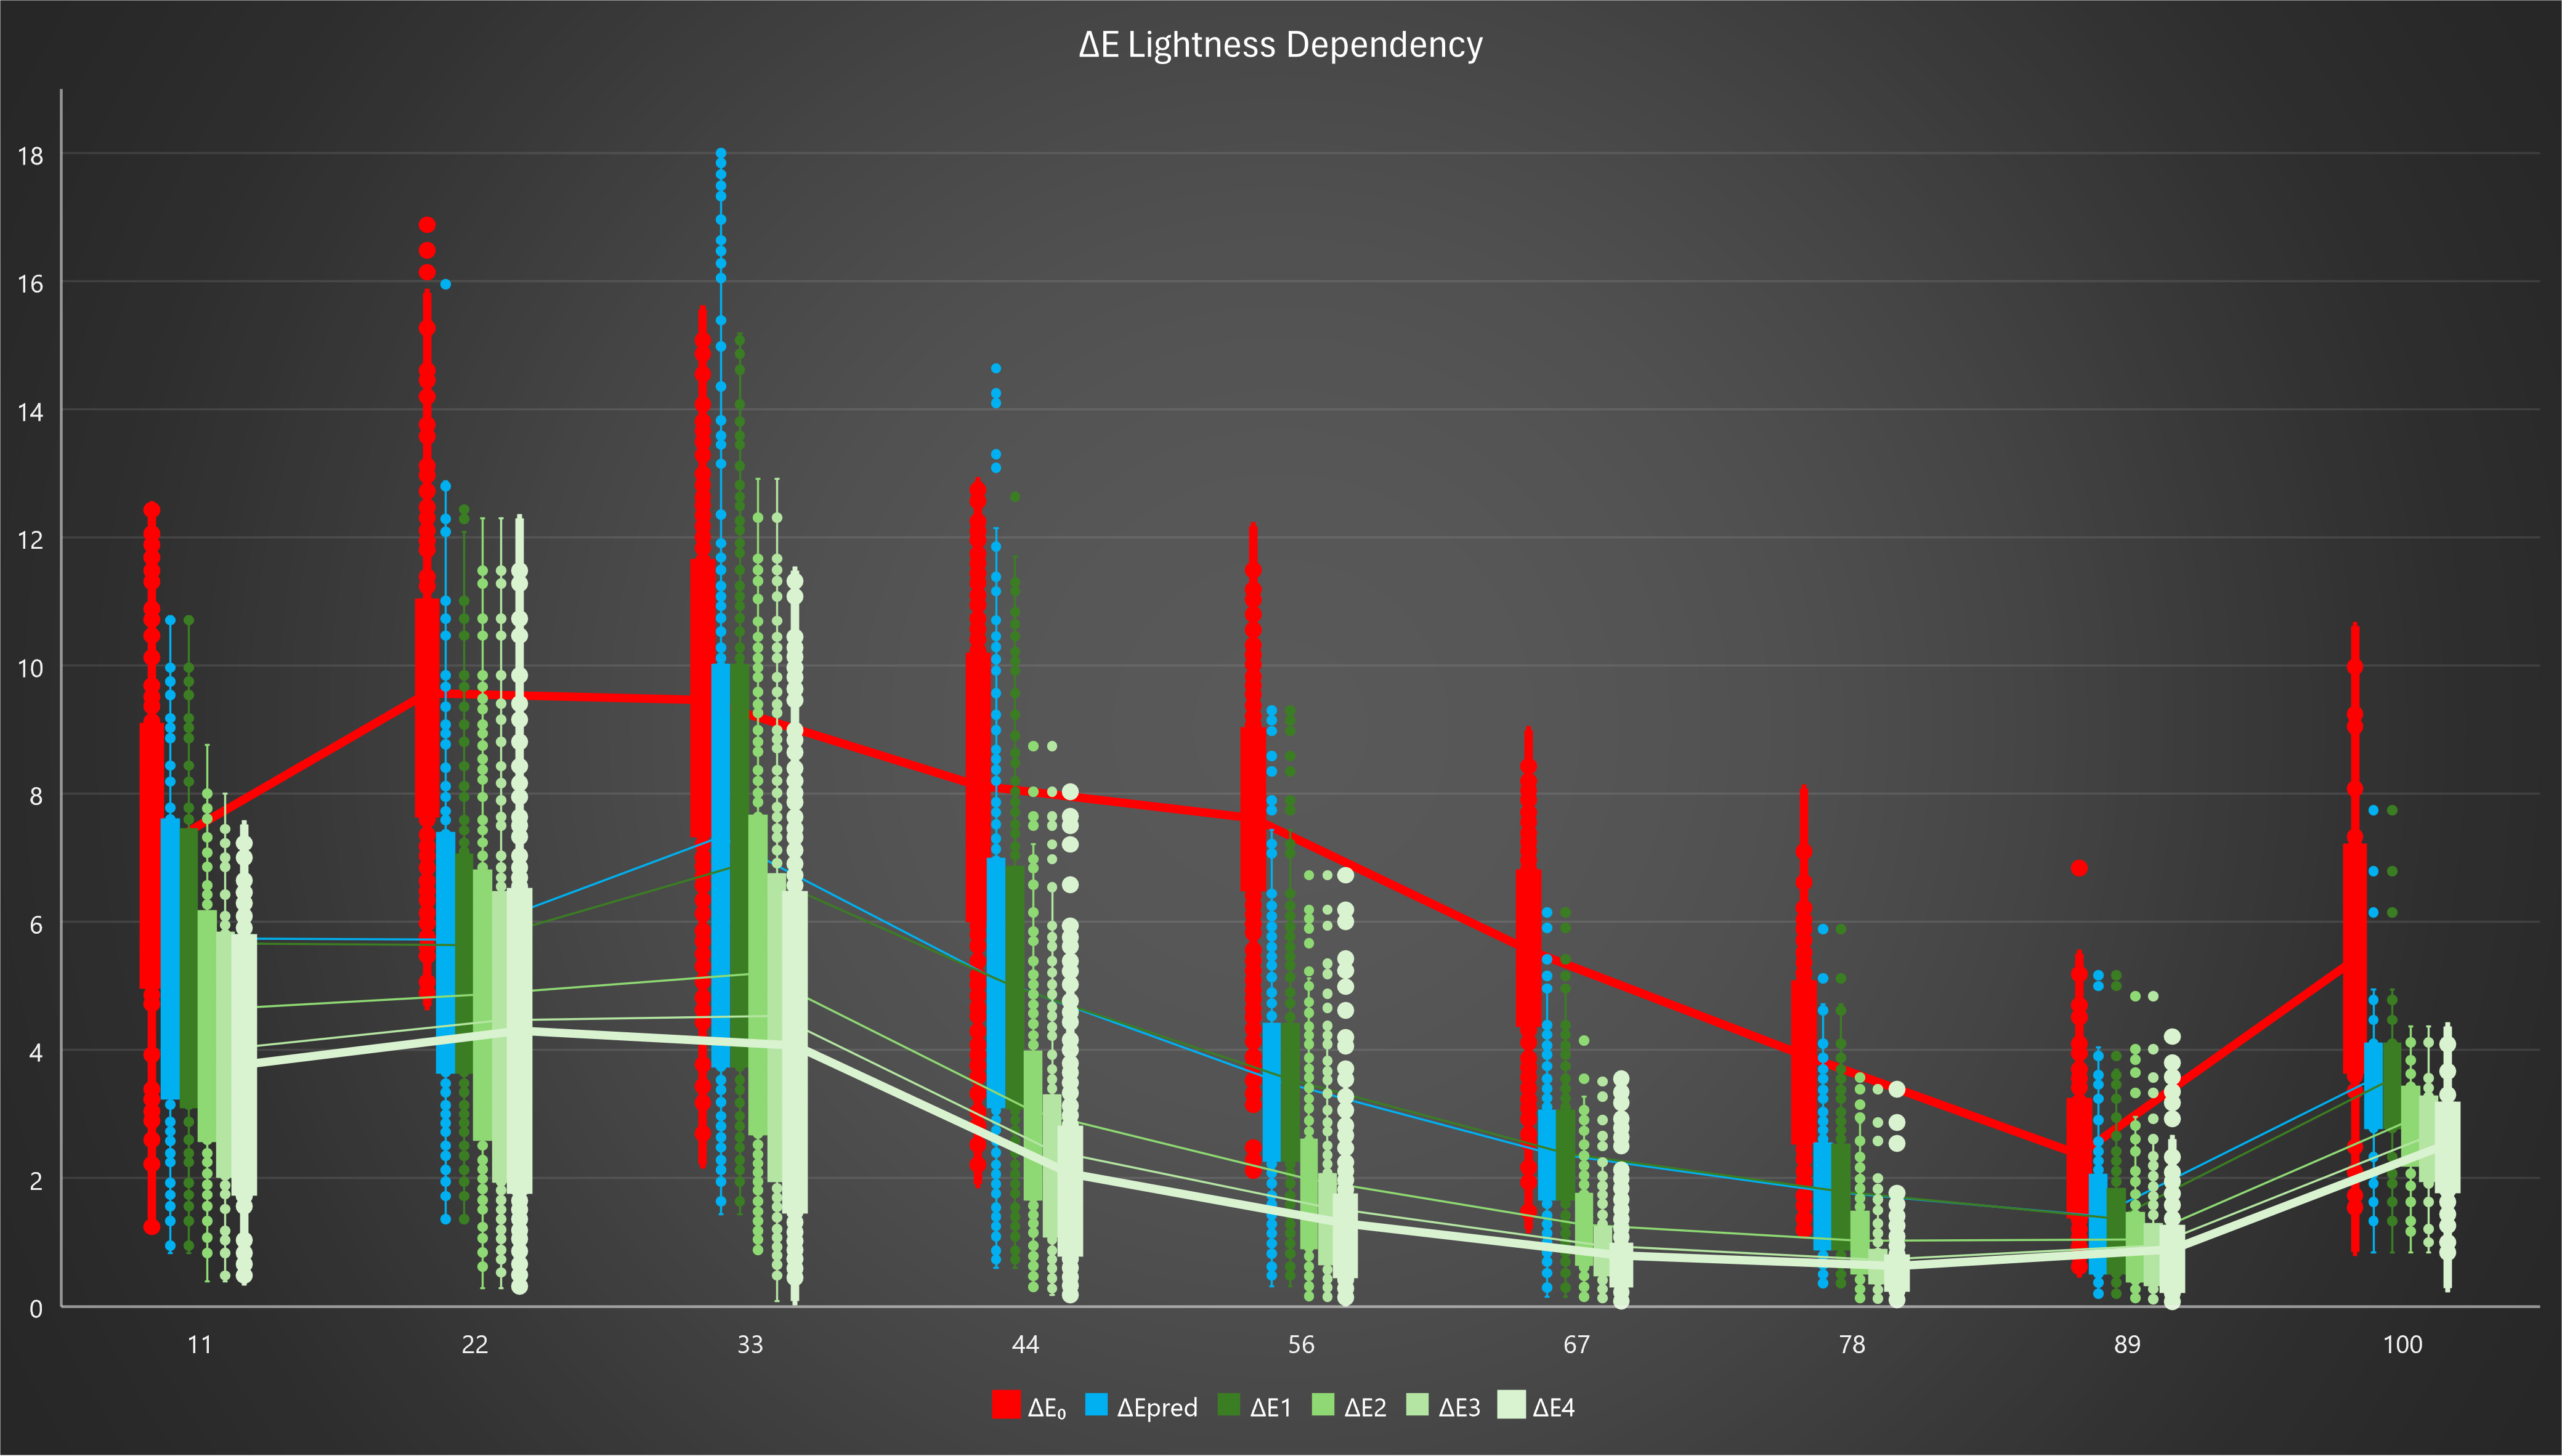
Figure 3 - ΔE ranges per iteration and grouped by lightness
- This graph shows the improvements in the area containing majority of the colors, but also the range of the deviations (minimum / maximum deviations).
- Similar to the structure of the color book, the colors and their deviations are sorted in relation to the lightness axis.